Data Visualisation
Understand your data better by turning it into easy-to-read visualisations which can be useful for improving efficiency and making better decisions.

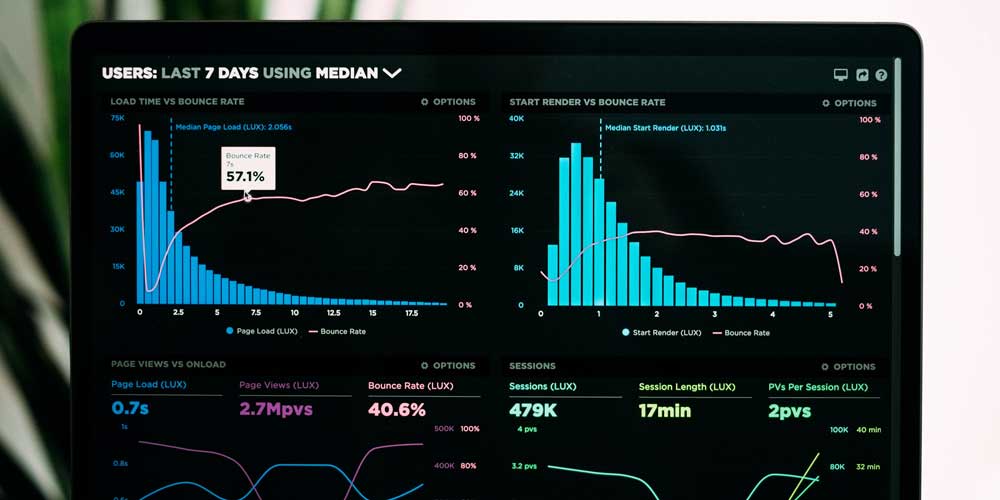
Develop responsive data analytics dashboards with a wide variety of customisable metric visualisations, allowing you to filter and analyse your data at a click of a button.
Visualisations of data are great for getting a better understanding of your data at a quick glance, and for business goal creation and insights.